
Monday, February 28, 2011
US Treasury Revises data of Foreign Holders of Treasury Debt
Once a year the US Treasury Department revises its data showing the foreign holders of US Treasuries. As explained here on the site previously, when Treasury debt is purchased by foreign entities, the sale is "booked" in the country of the transaction, not the country of origin.
As a general rule of thumb, the revisions are not usually not that significant except in the case of China, which for the past few years has conducted a large portion of its Treasury purchases through London financial centers. The result has been that when the revision takes place and the Treasury Department releases its data to reflect the country in which the actual debt is now owned, China has seen a rather large jump in its holdings at the expense of the UK, which sees a corresponding decrease in its reported holdings.
Today's revision by Treasury showed exactly this same pattern as China ended up with a reported increase of $268.4 billion in debt in the month of June 2010. From that month forward, their holdings either increased or decreased but it did so starting from a higher base.
I have updated my data to reflect these revisions and the charts as well that I have been using to provide a graphical view of all this. These new charts are presented below for your convenience.
Note, that after the revision, the gulf between the total reported holdings of China and those holdings now on the Federal Reserve's balance sheet has shrunk considerably but the fact is that the Fed is still the largest holder of US Treasury debt on the planet thanks to its QE program.


CCI notches another new all time high - Bonds yawn - Equities cry "Yippee"
Strength across the broad commodity sector has lifted the CCI to yet again another new all time high. Seeing that it is the end of February, we have what now amounts to a new all time high closing price on the daily, weekly and monthly charts.
This continues to occur across a backdrop of a weaker Dollar and a soaring stock market. The Fed of course will continue denying that there is any connection whatsoever with these developments and its QE policies, but the charts tell a different story.
Bernanke and company wanted to produce inflation to stave off what they view as the more dangerous deflationary pressures. They got what they wanted.

Meanwhile the bond market remains in its "See no inflation" problems mind set choosing to instead view rising energy prices from a deflationary standpoint rather than an inflationary one.
It does however appear to be stalling out a bit in its recent rise as traders sort out the implications of a move that has gone nearly straight up for the last three weeks.

The bonds and the equity markets cannot have their cake and eat it too. If the spike higher in crude oil and the liquid energies is going to be viewed as a sort of tax on the economy and work to slow things down, bonds will move higher as they are currently doing. If however, that is true and higher energy costs are acting as a drag on the economy, then the equity markets should not be moving higher based on the "improving economy" theme. That theme did not include crude oil and gasoline prices rising to current levels.
There is a complete contradiction between the movements in the bond market and those of the equity markets.
In both cases however, it is liquidity injections both into the equities and the bonds that have created the utter contradiction as the Fed's involvement in rigging the interest rate markets have created another distortion that will have to be dealt with.
4 Hour Gold Chart
See the chart for some comments on the price action.
Also, Friday's open interest revealed that reluctance or lack of conviction on the part of the bulls that I noted. The reduction in open interest with the market pushing up against the $1410 level but failing to muster sufficient strength to take it out shows the hesistation on the part of the bulls to go after the bullion bank offers in a more vigorous fashion. Instead, they looked at the roadblock and decided that coming in front of the weekend, they might as well just lighten up a bit and come back and see what the market was going to give them come Sunday evening in Asian trade.
The battle lines have been drawn on the charts as the bullion banks will commit great resources to blocking a move past $1420. They know that such an event would trigger an immediate run to the all time high near $1432.
The bulls need to hold it above $1400 on any dip lower in price to prevent a move back towards $1390. They must also waste no time in pushing back against the Bullion Banks capping effort if they are going to prevent some of their more fickle comrades from continued long liquidation as there is a serious attempt here by the bears to form a double top on the shorter term price charts.
The Dollar dropping below critical support at 77 level on the USDX gave gold a strong lift but it has recaptured that support level once again and by so doing, emboldened the gold bears. One can see the movement in the Dollar and the corresponding movement in the metal by observing the tick by tick price action.
See the technical analysis of the US Dollar that I posted over the weekend. The Dollar is trying to bottom here but if the bulls there cannot hold it above the 77 level as it goes into the closing period, it is very probable that the greenback is going to move down to 76. It just looks heavy. The bulls now have their back to the wall; if they fail to perform, things could get ugly in the Dollar in a real hurry.

March Silver Futures see continued drawdown in Open Interest
Open interest in the March silver futures contract experienced another sharp drop on Friday, adding to the substantial comedown seen on Thursday where it shed over 14,000 contracts. Friday witnessed a drawdown of a bit over 10,000 contracts bringing the remaining open interest in the March to 4,250 contracts. That is 21.25 million ounces of silver.
If there is going to be a short squeeze on the March, I would think that we should not see any further sharp reductions in that contract. If the specs keep bailing out at the present rate, any fireworks will have to wait until at least May unless of course someone wants to play the very thinly traded April contract. At this point I would have to say that the prospects of a squeeze in the nearby are diminishing.
In watching the spread between the March and the May, the market is currently out of backwardation by about 2 cents or so.
If the longs want the silver badly enough they will force the March to a premium back over the May contract.
We will just have to wait and see.
Even without this occuring, the price action in Silver is very impressive with it up nearly 3% at one point during the session. It continues knocking on the door of the $34 level and although it cannot seem to muster the energy yet to take that out, it is thus far not dipping very much either. I think that if the mining shares could show any significant display of strength, it would help silver run through $34 but so far nothing doing on that front.


Saturday, February 26, 2011
HUI - Gold Ratio, GLD and the Ratio Spread Trade
The following chart details this ratio from which one can determine the performance of the gold shares in general against the price of the actual metal. It was in 2006 when I believe that the hedge fund world began implementing their ratio spread trade, in which they are going long the metal or the ETF and shorting some of the various gold shares. Since that time, the shares have acted as if there was a lead weight upon them compared to the price of gold itself with the exception of course being the announcement of the QE program in late 2008 alongside of the TARP.
You will note that this was not the case during the infancy period of this decade+ long bull market in gold. For nearly 3 years, the gold shares outperformed the metal itself as one can easily see by noting the soaring ratio. (2001 - late 2003).
I do not think it is any coincidence that once the GLD ETF was formed, the HUI - Gold ratio never exceeded the previous peak reached late in 2003. That ETF was formed and open for trading in November 2004. While the ratio did manage to move higher into early 2006, it peaked and then moved lower failing to better its high water mark from late 2003.
If there was ever a vehicle invented to siphon money out of the mining sector shares, GLD was it. Hedge funds and other large players seeking leveraged exposure to the gold price no longer had to go the mining share route but could instead margin up on GLD and play it that way. They also could make a pure play on the metal without worrying about geopolitical surprises, environmental issues, labor disputes, management issues, or dwindling gold reserves. In other words, they could get leveraged exposure to gold without dealing with the other risks associated with buying shares in a particular mining company.
For some hedge funds in particular, this became an opportunity to establish a spread trade in which they could go after companies which might be inherently weak but were merely being pulled higher along with the overall gold sector. Thus was born the ratio trade.

Since 2006, this trade has made a huge amount of money for the hedge funds. When the credited crisis erupted in the summer of 2008, they rode that trade all the way to bottom making a fortune out of it as the stock market collapsed dragging everything remotely resembling a paper share violently lower. Even as gold and silver prices imploded, the price of the gold and silver shares imploded even faster. Translation - the hedge funds playing this ratio trade made a fortune.
That changed rather abruptly in late 2008 when the Fed announced the beginning of a Quantitative Easing policy on the heels of the TARP program. The equity markets saw that as a bonanza for stocks in general and up went the Dow, the S&P, and the Nasdaq. In such an environment, hedge funds and other large players did not want to be short any kind of stocks at all, and they began a violent wave of short covering in the mining shares which sharply reversed the downward trend in the HUI-Gold ratio. The shares began outperforming the metal once again until the summer of 2009 when it appears that the hedgies then began treating the sector differently and re-established the ratio spread trades once again.
As you can see, the ratio has gone nowhere since then and has ground lower reflecting the poor performance of the mining shares in general against the metal price itself.
I believe that we will need to see a pattern emerge on this chart informing us of when this trade is falling out of favor with these gigantic hedge funds before we can expect the mining shares to outperform the metal once again.
The net of all this is that those who buy gold and silver shares will need to do their homework and analyze what they are buying carefully. There are miners out there whose shares are doing very well even in this ratio trade environment. Hedgies will not lean on the shares of these stronger companies because there is not as much profit in it for them. Instead they will go after those issues which they view as having inherent weakness somewhere. One cannot just blindly throw money into the gold or silver miners just because gold and silver are in a bull market and expect to get ahead while this ratio trade is in operation. Do your homework and choose carefully. Getting frustrated and discouraged will not make the hedge funds feel sorry for you and take their marbles and go home just to suit your wishes. It is a ruthless business out there and in order to survive, you must learn to be unemotional about these things.
A technical look at the US Dollar
Following are some price charts of the US Dollar to give an overview of where it stands from a technical analysis perspective. We will look at all three major time frames, the daily, weekly and monthly as well as a shorter term 4 hour chart.
Let's start first with the daily.
As you can see, the Dollar is trading firmly below all 4 of the major moving averages that I have charted here; the 10, 20, 40, and 50 day. All are trending lower with the 10 day having just completed a bearish downside crossover of the longer 20 day moving average. This tells us that the market is in a decided downtrend as all the moving averages are speaking with the same voice.
The market has moved down right into a major chart support level near 77. On Friday, it briefly penetrated that level but then rebounded and managed to close higher on the day, but just barely.
I should note here that the particular technical indicator I am referencing in this study, the Relative Strength Index, or RSI, is showing a slight loss of dowside momentum and is registering a very faint bullish divergence signal. To validate this signal, the Dollar would need to pull off a strong close above 77.90.
Summary - the market is weak, trending lower but attempting to hold here. Whether it can or not remains to be seen as we head into next week.

Next is the weekly chart:
There are several things to note about this time frame. First all of the same period moving averages, 10, 20, 40 and 50 week moving averages are moving lower confirming the weak pattern. The shorter 10 week moving average however is above the 20 week but is now pointed lower. It made a bullish upside crossover of that same 20 week average on the end of the year rally but once the market failed to extend past the 50 week moving average and turned down it too began moving lower. It has not yet made a bearish downside crossover of the 20 week but is very close to so doing.
The RSI is confirming the weakness in the market as it failed to muster enough strength to even clear the 60 level on its rally of the last few weeks of 2010. This is textbook bearish action when a market in a prolonged bear trend stages a relief rally which cannot pull the RSI above the 60 level. I will not be convinced that there is anything significant going on with the US Dollar until and unless its weekly RSI reading can move past 60 and preferably 65.
Summary: - market is bearish with no signs of positive or bullish divergence with that being confirmed by an RSI reading signaling a bear trend. Price is sitting on top of a weekly support level, which if it cannot hold, will send the RSI down further adding confirmation to the bear move.
By the way, note the huge double top formation spread across two year's time up near the 90 level.

Then we move to the monthly chart:
As with the daily and the weekly charts, the price is trading below all of the major moving averages, 10, 20, 40 and 50 month. These moving averages however are not reflective of a market in a trending move but rather one in a sideways congestion pattern. Note that the shorter term moving averages are actually above the longer term averages but are all pointed lower. In other words, the market is not trending on a very long term basis.
This is also reflected by the RSI which is moving roughly between the 60 and the 40 level. Any pattern like this on the RSI is a congestion pattern with no clear trend.
Summary: The market is basically moving sideways but because price is currently below all of the major moving averages, the bias is to the downside.

Finally we come to the shorter term, 4 hour time frame:
What we see here is a market that tested support near 77 and uncovered buying which took it slightly above 77.50 before it ran out of steam. If the market is going to push higher early next week, it will take out the resistance zone noted on the chart with its top just below 77.60. The RSI is bearish and will remain so unless it takes out its blue overhead line at 60.

King World News - Weekly Metals Wrap
Dear friends:
You can listen to my regularly weekly radio interview with Eric King of King World News on the Metals Wrap segment by clicking on the following link:
Bill Haynes gives his usual great insight into the customer demand side for the metals in the lead in followed by myself talking about the metals action for the past week.
http://www.kingworldnews.com/kingworldnews/Broadcast/Entries/2011/2/26_KWN_Weekly_Metals_Wrap.html
Friday, February 25, 2011
4 Hour Gold Chart - End of trading week
I will have some daily and weekly charts up of both the metals this weekend along with some other markets that impact them both.


Backwardation Structure appears to Easing in Silver - but is it?
Reposting from earlier this AM:
The strong backwardation structure that has existed in the silver market for some time, at least on the futures board, appears to be easing even as the March contract goes into its delivery period. This is happening even as we continue getting reliable reports of tightness in the spot market and long waiting periods for silver bars.
March silver's open interest is drawing down rapidly having dropped a bit over 14,000 contracts in yesterday's wild session. There is a decent amount of rolling out of March into May based on the exchange's today, but it is not a one for one roll. Both longs and shorts bailed out yesterday.
There are still a considerable number of contracts open in March, 14,259 to be exact, but we have today's session yet which no doubt will see a further reduction in that contract month.
If a squeeze is going to occur, we will need to see the March return to a premium to the May and preferably also to the July.
Here are the spread charts detailing the change from one of backwardation to a more normal contango situation. When a backwardation structure exists, the spread line will be above zero; when contango exists, the spread will be below zero.
As you can see, the backwardation structure has been easing. At the risk of repeating, if there will be a move to push the shorts during the delivery period in the March next week, this spread line will indicate it by moving back above zero against the May and if it is particularly strong, also against the July contract. I do wish to point out however that while the backwardation structure of the March has eased it is just barely in contango.
Keep in mind that this chart is a snapshot in time and can change so we will need to continue to monitor this for further developments.
To get an even more accurate read on this we would need to capture a snapshot in time comparing the spot silver market bid/offer to the current bid/offer of the nearby March silver contract. At the time I am posting this, spot silver is actually trading about 6 - 7 cents higher than the nearby March futures contract which makes the current structure of the Comex silver market seemingly at odds with the physical market once again. In other words, we have a rather strong backwardation in the physical market but an easing backwardation moving towards contango on the paper market.
An ideal situation for a short squeeze exists when both the futures board and the spot market are speaking with the same voice. In the case of what we have now, if the physical market is as tight as it seems to be, there should be a large number of players standing for delivery in the March. AFter all, if you are a large buyer of silver, and you can get the exact thing by buying a March futures contract at what is a DISCOUNT to the physical market, who in their right mind would not want to do that? If nothing else, a player with the right connections could arbitrage the setup and guarantee an immediate and healthy profit.
Stay tuned on this one. With Silver there is never a dull moment.


India moves towards direct Yuan convertibility
Thanks again to David for providing what I view as a very significant news article out of the Times of India.
You might recall that I had posted an article dealing with the concentrated efforts by the Chinese authorities to work towards this very thing just recently- namely, the effort to make the Yuan an international currency. The biggest hindrance to this has been this lack of convertibility. Once this issue is resolved, and it looks as if there is now a serious, concerted effort in this direction that is gaining in popularity, it is going to be yet another nail in the coffin of the US Dollar.
You might recall that I had posted an article dealing with the concentrated efforts by the Chinese authorities to work towards this very thing just recently- namely, the effort to make the Yuan an international currency. The biggest hindrance to this has been this lack of convertibility. Once this issue is resolved, and it looks as if there is now a serious, concerted effort in this direction that is gaining in popularity, it is going to be yet another nail in the coffin of the US Dollar.

One Wise Central Bank
The following headline from a Dow Jones Newswire Service report says it all. You can be assured that many other Central Banks are also seeing the yellow metal in a favorable light.
Note the relatively low levels of gold in the reserves of Brazil, a rising economic powerhouse and an increasingly important buyer of US Treasuries. Look for this nation to begin an acquistion process of gold in the months and years ahead.
DJ Argentina's Gold Bet Pays Off As Metal Nears New Highs
By Ken Parks
Of DOW JONES NEWSWIRES
BUENOS AIRES (Dow Jones)--The Central Bank of Argentina's decision to add
gold to its foreign reserves nearly seven years ago has paid off, with the
precious metal trading close to the record highs observed in late 2010.
The central bank reported 9.41 billion pesos ($2.33 billion) of gold on its
balance sheet at the end January, equivalent to nearly 4.5% of its total
foreign-currency reserves of ARS210.51 billion, according to data published on
its website. A year earlier, those holdings were valued at ARS7.28 billion.
Argentina's central bank significantly increased its holdings of gold during
the first seven months of 2004, when it purchased 1.76 million troy ounces for
an average price of $398.87 per ounce.
According to the institution's most recent annual report to Congress, the
central bank held 1.76 million ounces of gold at the end of 2009.
Alfonso Prat-Gay, who was president of the central bank from December 2002
until September 2004, said that at that time bank staffers opposed the purchase
of gold because they feared the political and legal repercussions had the
country's creditors been able to embargo the transaction. Argentina defaulted
on about $100 billion in sovereign debt in 2001.
"The bank had gotten rid of all of its gold in the 1990s and at that moment
it didn't have any exposure to gold. It seemed to us a prudent policy to have
5% of our liquid reserves in gold and at the time we were prepared to increase
that position in the future," he said in an emailed statement to Dow Jones
Newswires.
Citigroup Inc (C) expects gold to rise 7.8% this year to $1,445 an ounce
after averaging $1,340 last year. If correct, that could make gold one of the
highest-yielding assets in the Central Bank of Argentina's foreign-reserve
holdings this year, with benchmark interest rates in the U.S. and Europe still
at rock bottom lows.
Gold is viewed by some investors as a hedge against inflation and volatile
currencies. Earlier this month, gold inched closer to becoming a currency after
U.S. banking giant J.P. Morgan Chase & Co. (JPM) said it would allow clients to
use the precious metal as collateral in some transactions in which banks
typically accept only U.S. Treasury bonds and stocks.
Barrick Gold Corp. (ABX, ABX.T), the world's largest producer of the precious
metal, said in an interview published Feb. 1 in the Wall Street Journal that it
expects central banks to move more of their monetary reserves into gold this
year due to concerns about the value of their U.S. dollar holdings amid a
sluggish U.S. economy and rising government debt.
"Nothing in this world is safer than physical gold and its opportunity cost
has never been as low as it is today given risk-free interest rates are at
zero. All central banks should have an important exposure to gold. In my
opinion 20% of reserves should be a floor," said Prat-Gay, who today is a
congressman and a member of the Coalicion Civica party.
A central bank spokesman contacted by Dow Jones Newswires said the monetary
authority doesn't comment about its reserve policy.
Although gold represents only a small percentage of its reserves, the Central
Bank of Argentina's holdings are among the largest of its peers in Latin
America.
The Central Bank of Peru held 1.1 million troy ounces, valued at $1.48
billion, at the end of January, or about 3.3% of its reserves. Brazil's central
bank owned 1.08 million troy ounces of gold worth about $1.43 billion,
equivalent to just 0.5% of its total reserve assets.
Chile's central bank had less than 0.05% of its reserves in gold with
CLP5.121 billion ($10.7 million) on its balance sheet at the end of January.
Meanwhile, the Bank of Mexico held about 230,000 troy ounces at the end of
December, with the value of its holdings of physical gold and gold swaps
totaling $322 million, a drop in the bucket compared to its foreign reserves of
$120.59 billion.
-By Ken Parks, Dow Jones Newswires; 54-11-4103-6740, ken.parks@dowjones.com
(END) Dow Jones Newswires
02-25-11 1410ET
Copyright (c) 2011 Dow Jones & Company, Inc.
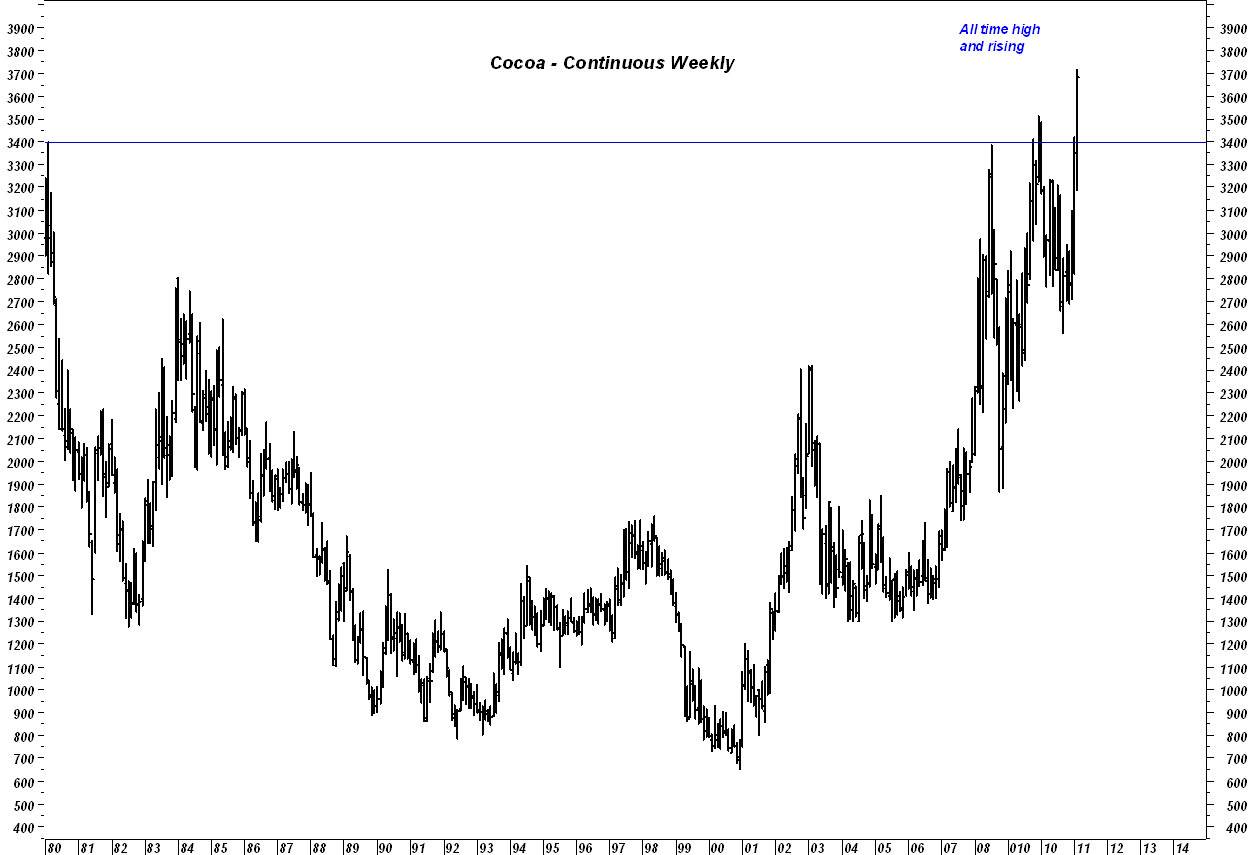
Don't mess with my Chocolate
Look, I can handle price rising for all kinds of food. I understand that the Fed has created a perfect storm in the commodity markets with its shortsightedly destructive QE policies. And while I resent the fact that they are intent on destroying the US Dollar and with it, the way of life for my kids and their grandkids, nothing riles me more than to see what they have done to my chocolate. When inflation hits this commodity, now you are getting personal. After all, a man's chocolate is sacred - I might add here that I suspect that there are a lot more women who would second this.
Just make sure that if you start hoarding chocolate, that you don't stash it in the attic!

Just make sure that if you start hoarding chocolate, that you don't stash it in the attic!
Hedgies run back into Grains - Up goes the CCI
For those of you who might have seen the original "Karate Kid" movie, you will recall that great scene where Mr. Miyagi, played by the now deceased Pat Morita in instructing his young student, Daniel LaRusso in the finer arts of waxing classic automobiles. His famous lines: "Wax On; Wax Off", come to my mind with increasing frequency these days in observing the wild price swings occuring in the commodity markets.
Take corn for example - Earlier this week the hedge funds were throwing it all away on the stupid notion that a rising crude oil price would force people to give up eating and somehow also suppress the appetite of livestock and poultry. WAX OFF
Today they are back in there loading up on the yellow foodstuff after end users bought every bit of what they threw away and reminded the world that human and animal appetites do not particulary care what the cost of crude oil might happen to be. WAX ON
Tomorrow, who knows.
The result of all this buying across the food complex has been to push the CCI, the Continuous Commodity Index right back up against its recent all time high, setting up a very real possibility that the index will CLOSE at a new all time high price. Were it not for the current bout of weakness in the precious metals, the CCI would have gone on to make an all time high once again.
Maybe the bond market will eventually get the message and come out of its fairy tale, Fed-created La La land.


This time it's Vietnam dealing with Inflation
One nation after another across Asia is fighting this beast. Yesterday we saw it was India, previously we have seen it was China, and now we see it is Vietnam. More fuel for the gold and silver demand fire.
Thanks to Paul for sending this my way.
Headline:
http://online.wsj.com/article/SB10001424052748703842004576163483115005302.html
Thanks to Paul for sending this my way.
Headline:
Vietnam Steps Up Its Inflation Fight
You can read the entire article here:http://online.wsj.com/article/SB10001424052748703842004576163483115005302.html

Backwardation Structure appears to Easing in Silver - but is it?
The strong backwardation structure that has existed in the silver market for some time, at least on the futures board, appears to be easing even as the March contract goes into its delivery period. This is happening even as we continue getting reliable reports of tightness in the spot market and long waiting periods for silver bars.
March silver's open interest is drawing down rapidly having dropped a bit over 14,000 contracts in yesterday's wild session. There is a decent amount of rolling out of March into May based on the exchange's today, but it is not a one for one roll. Both longs and shorts bailed out yesterday.
There are still a considerable number of contracts open in March, 14,259 to be exact, but we have today's session yet which no doubt will see a further reduction in that contract month.
If a squeeze is going to occur, we will need to see the March return to a premium to the May and preferably also to the July.
Here are the spread charts detailing the change from one of backwardation to a more normal contango situation. When a backwardation structure exists, the spread line will be above zero; when contango exists, the spread will be below zero.
As you can see, the backwardation structure has been easing. At the risk of repeating, if there will be a move to push the shorts during the delivery period in the March next week, this spread line will indicate it by moving back above zero against the May and if it is particularly strong, also against the July contract. I do wish to point out however that while the backwardation structure of the March has eased it is just barely in contango.
Keep in mind that this chart is a snapshot in time and can change so we will need to continue to monitor this for further developments.
To get an even more accurate read on this we would need to capture a snapshot in time comparing the spot silver market bid/offer to the current bid/offer of the nearby March silver contract. At the time I am posting this, spot silver is actually trading about 6 - 7 cents higher than the nearby March futures contract which makes the current structure of the Comex silver market seemingly at odds with the physical market once again. In other words, we have a rather strong backwardation in the physical market but an easing backwardation moving towards contango on the paper market.
An ideal situation for a short squeeze exists when both the futures board and the spot market are speaking with the same voice. In the case of what we have now, if the physical market is as tight as it seems to be, there should be a large number of players standing for delivery in the March. AFter all, if you are a large buyer of silver, and you can get the exact thing by buying a March futures contract at what is a DISCOUNT to the physical market, who in their right mind would not want to do that? If nothing else, a player with the right connections could arbitrage the setup and guarantee an immediate and healthy profit.
Stay tuned on this one. With Silver there is never a dull moment.
Thursday, February 24, 2011
4 Hour Gold Chart
Dear friends:
I have gone to a 4 hour chart on gold to try to catch some of the volatility in these precious metals markets a bit earlier. The daily chart is simply too slow in these market conditions other than for those who have a bit longer term perspective and are doing more of a position trade and thus willing to ride out larger price swings. If you are actively trading, you are probably using even shorter term charts than this such as a 30 minute or even 15 minute.
I will still post the daily chart on a regular basis, time permitting, but want to make these shorter term charts available. We can still do our studies on that daily as well as the weekly which are the key to getting a bigger view of the market in general.
We can use this 4 hour chart to better pinpoint some of the support and resistance levels that are being formed by the market action.
Note the levels shown on the chart and wait to see the market action around those levels.
Volume to the upside has been decent but I would prefer to see it a bit stronger. It still exceeds downside volume however which is friendly.
The nice move from near $1355 to $1410 was a trending move as evidenced by the rising ADX line. Directional movement to the upside has been consistently above any downside movement even on the retracements in price until this afternoon. We experienced our first downside crossover of the positive directional movement line (blue) over the negative directional movement line (red). What we want to watch for now is the action of these two lines as they give us a feel for which of the forces, bull or bear, can seize control of the market from this point.


Inflation raging in India
Courtesy of an industrious reader David, who scours the globe gathering stories of interest, comes this story reinforcing the challenges being faced by nearly all of the nations across Asia due to the rising cost of food, not to mention overall inflation pressures in general.
This is why the gold and silver markets will find buying on dips in price.
Asian demand will keep a solid floor of support beneath these markets that we will be able to discern from watching the price charts. Those in the West may throw the metals away dismissing inflation concerns, but those concerns are very much alive and unfortunatey all too well in Asia.
Thousands protest against high food prices in Delhi
You can read the entire story here:
http://www.bbc.co.uk/news/world-south-asia-12549050
Thousands of people have gathered in the Indian capital, Delhi, to take part in a rally to protest against rising food prices and unemployment.
Federal Reserve adds $22 billion in Treasuries to its Balance sheet this week
In keeping with its theme: "One can never own enough US Treasury Debt", the Federal Reserve, the largest holder of US Treasury debt on the planet, added another $22 billion worth of Treasuries this past week, courtesy of the QE2 program.
While they were doing that, they continue to sell those Mortgage Backed Securities that they purchased under the QE1 program. They have sold nearly $170 billion worth of MBS's in the last 8 months. Apparently the proceeds are going to secure more Treasuries.
Since the beginning of December last year, the Fed has added an average of $25 billion worth of Treasuries to its balance sheet each week. At that rate, they will have added another $350 billion in Treasuries by the first week of June. That would bring the total Treasury holdings in their balance sheet to $1.55 trillion putting them very much on target to exceed the combined Treasury holdings of both China and Japan.

Some thoughts on today's wild ride
Last evening I posted a chart detailing a spread between the CRB index and the CCI (Continuous Commodity Index) about which I remarked could be seen the reallocation of hedge fund investment money towards the energy sector and away from the broader commodity sector in general, namely foods and metals.
That seems to have been the theme of today's action as well based on that spread chart. Today, the grains, most notably, wheat, were down, cocoa was lower, coffee was lower and the hogs and most cattle contracts were lower. Cotton was limit down as well. While crude oil settled well off its peak near $103 and gasoline faded from its best level near $3.03, the energy sector still fared better than some of the various commodity markets.
It is clear that there is some position reallocation taking place among the hedge funds towards a larger exposure in the energies. This might be partially responsible for removing some of the bids that we saw today in both gold and silver.

Later in the afternoon, it seemed as if hedge fund money flows into the commodity sector dissipated somewhat particularly as crude faded with money flowing back into equities once again. That took the broader stock market well off its worst levels of the session and might have put a damper on safe haven related buying of gold and silver.
There is a great deal of uncertainty and confusion reining across all of the markets currently as no one is sure where events in the middle East are going to end up going next. That has traders very jumpy and reacting, strike that, overreacting to the least bit of changes in price. No one wants to be caught on the wrong side of a development. Be careful trading therefore and do not get your position sizes too large for the size of your trading account, no matter what you may or may not think things should be doing. You might be right, but if you are not, you will pay very, very dearly for being wrong and quite possibly will not be around to play the game the next time.
Hedge Funds continue drinking from the Bernanke Punch Bowl
Anyone who is still wondering why stocks had been rallying nearly straight up since November of last year, prior to the drop over the oil price rise the last two days, has only to note this following blurb from an article posted at Bloomberg's web site today.
Hedge funds increased their net leverage in January to the highest level since October 2007, as they took advantage of record-low borrowing costs to bet that the U.S. equity rally will continue. Debt at margin accounts at the New York Stock Exchange minus cash and unused credit climbed to $46 billion, according to data released by NYSE yesterday.
I seem to recall a period of time in ancient history when the duty of the Central Bankers was to take away the punch bowl. This Fed not only refuses to take it away, they are offering Happy Hour specials.
Here is the full story....
http://www.bloomberg.com/news/2011-02-24/u-s-stock-index-futures-drop-as-oil-price-surges-bank-of-america-slides.html
If oil prices take a tumble any time soon, the equity markets will likely launch another big rally with bonds tanking hard. If oil stabilizes near current levels, the S&P will probably see two-sided trade as it pauses a bit to gauge how the economy is handling the higher gasoline and energy costs. If the events in Libya were to spread to Saudi Arabia, for any reason, all bets are off the table as the equity markets will get slammed by crude oil charging towards $120 for starters.
Gold is now caught up in this same waiting and watching game as is silver now to a certain extent, athough it has been moving higher for other reasons than what are moving gold.
If there is going to be any short squeeze or issues associated with potential delivery problems in silver, they are going to affect the March contract next week. Watching how that process unfolds and what becomes of the board structure for the various contract months in silver will tell us a great deal as to what is transpiring.
Silver dropping sharply in the low volume aftermarket
Some big entity has come into the silver pit this afternoon and taken advantage of the low volume trading conditions to lever the fall in crude oil prices to go after the downside stops in silver. Based on what is now occuring, they have succeeded.
One other notable thing is now occuring - the backwardation structure in the front three silver month contracts is easing and while it is not yet at the usual contango, it is moving towards that direction. This is significant and bears watching.
Silver has now fallen towards the last level of chart support before $31. If it does not hold near $31.50, it is going to retrace down towards $31. Below that we are back to $30.50


Wednesday, February 23, 2011
CRB Index versus the Continuous Commodity Index
Most of those who have followed my writings over the years are aware of the fact that I make frequent references to the CCI or Continuous Commodity Index when detailing the performance of the overall commodity sector.
The reason for this is simple - I prefer the well balanced weighting of the various basket of commodities that comprises the CCI to give a better view of the commodity sector in general when attempting to gauge its performance.
The CRB on the other hand is heavily weighted in the energy component. There is nothing wrong with this as this is the deliberate choice of the those who designed this particular index. They felt that because energy costs had such a significant impact on so many areas of the economy, that any view of the commodity sector's performance should include an index that put a greater emphasis on the role of energy when constructing that index.
I have often commented that those analysts who were citing the CRB when giving their views on commodity price inflation were doing their readers or listeners a disservice because the index was so heavily weighted in energies, that it was giving a lopsided representation of what was happening in the food and metals sector whenever the price of crude oil was lagging, as has been the case for some time now.
I still maintain that view; however, there is a use of the CRB index that I have found helpful in examining the commodity sector as a whole particularly in attempting to gauge the thinking of the large scale speculative community when it comes to money flows.
The following chart is a spread between the CRB index and the CCI. If you will note, the general tenor of this chart has been a decline that began in late 2008 and has continued for the most part until the present time. The reason for this is simple - back in 2008 crude oil reached the dizzying height of nearly $150 barrel before it began a sharp collapse. That collapse in price was magnified when compared to the rest of the sector as a whole which while it too moved lower, did not fall from such stratospheric heights as did crude oil.
In other words, the CRB was underperforming the broader CCI telling us that within the broad commodity sector, crude oil and the liquid energies in general, were out of favor by the hedge fund community in comparison to the food and metals segment of this sector.
As long as this line moved lower, the energy sector of the commodity complex was not viewed as attractive as a place into which to plow money as the food and metals.
Given the fact that we are now seeing sweeping unrest across the oil exporting Middle East with the resultant surge in oil and liquid energy prices, the CRB index can be expected to outperform the CCI IF the hedge fund community is now beginning the process of investing more heavily in this segment of the commodity sector and lightening up a bit on their exposure to the foods, softs and metals. This is not to suggest that those just mentioned segments are about to undergo declines. Quite the contrary - we all can see what silver is doing for example along with some other markets such as cocoa and hogs. However, what might possibly be the start of a new trend is that the energies are finally going to become the recipients of a great deal of fresh money flows that could help this sector play catch up to the rest of the commodity world.
If that is indeed the case, this spread will confirm it by moving higher and reversing the downtrend that has been in place for 29 - 30 months. Quite simply, the liquid energy markets have been badly lagging and have a lot of ground to make up.
Stay tuned on this one because it will depend on what else transpires across the middle East.

A Little Silver Bull Humor
I like to think of JP Morgan as being the self-assured, arrogant and overreaching DEA officer and the rancher as the friend of the silver bulls.
The Arrogance of Authority

The Arrogance of Authority
A DEA officer stopped at a ranch in Texas , and talked with an old rancher.
He told the rancher, "I need to inspect your ranch for illegally grown drugs."
The rancher said, "Okay , but don't go in that field over there.....", as he pointed out the location.
The DEA officer verbally exploded saying, "Mister, I have the authority of the Federal Government with me!"
Reaching into his rear pants pocket, he removed his badge and proudly displayed it to the rancher.
"See this badge?! This badge means I am allowed to go wherever I wish.... On any land!!
The DEA officer verbally exploded saying, "Mister, I have the authority of the Federal Government with me!"
Reaching into his rear pants pocket, he removed his badge and proudly displayed it to the rancher.
"See this badge?! This badge means I am allowed to go wherever I wish.... On any land!!
No questions asked or answers given!! Have I made myself clear...do you understand?!!"
The rancher nodded politely, apologized, and went about his chores.
A short time later, the old rancher heard loud screams, looked up, and saw the DEA officer running for his life, being chased by the rancher's big Santa Gertrudis bull......
The rancher nodded politely, apologized, and went about his chores.
A short time later, the old rancher heard loud screams, looked up, and saw the DEA officer running for his life, being chased by the rancher's big Santa Gertrudis bull......

With every step the bull was gaining ground on the officer, and it seemed likely that he'd sure enough get gored before he reached safety. The officer was clearly terrified.
The rancher threw down his tools, ran to the fence and yelled at the top of his lungs.....
"Your badge, show him your BADGE........!!"
4 Hour Silver Chart - update
Here is the late afternoon silver chart as it heads into trade in Asia.


Bond Market update
The long bond has been the beneficiary of safe haven flows over the last few days which from a technical perspective has greatly altered its once decidedly bearish price chart.
This market, which had been held together from the month of December to very early in February by Federal Reserve purchases related to its QE program, broke down sharply earlier this month turning and appeared to be on course to ending a trending move to the downside.
That began to change last week once the market was able to push back into the former congestion zone although it lacked the ability to actually manage a close within that zone. Once the unrest in the middle East began flaring further and crude oil rocketed higher, the bonds staged a huge rally easily penetrating into the zone today pushing towards the level that had effectively contained price for those 7 weeks.
Whether it was the poor auction results of today or whether it was the fact that the rally had made bonds too expensive for the lower yields, they are clearly hesitating at today's peak.
It will be up to the bond bulls to take price convincingly through the upper level near the 121^28 region if they are to make this anything more than a return to another trading range. Failure to do so will more than likely see the bonds retrace a decent portion of this week's gains and then test whether or not we are back to the consolidation pattern once again.
While commodity prices continue their surge higher, this time led by the energy sector, which I might add, I have been commenting on for some time as being the laggard of the sector, one would think that the spectre of inflation would be resulting in a wholesale reguritating of bonds particular at the rate at which the Federal government is cranking them out. So far that has not been the case as the current mentality in the bond pit is more short-sighted and is looking at the spike in crude oil prices and the rest of the liquid energies as a type of tax on the entire economy which will slow down economic growth. I think this is absolutely correct for the short term.
Higher energy costs will impact everyone, regardless of whether individuals or business owners. Profits will suffer unless this cost increase can be passed on to end users and consumers. If businesses are fearful of passing the costs on out of concern with maintaining their customer base, how can they increase hiring if their profits are not growing? The answer is self-evident - they cannot. No hiring - fewer jobs - slower growth - this is what the bonds are currently thinking.
One has to wonder however if at some point they must pass on the increase in costs in order to remain viable. Whether it becomes another fuel surcharge or whatever, if crude oil prices do not retreat, it will certainly occur. Then we get the inevitable cost push inflation that so many of us fear is coming.
First it was food and industrial metals; now it is energy. What else is left? Maybe we could all give up our automobiles and trucks and get horses but they have to be fed and grain is out of sight for those who do not have plenty of pasture land available! Walking is an option I suppose but as the Dollar shrinks in value, the cost of those imported sneakers starts rising as well.

Daily Market Commentary
Strong upmoves in both gold and silver today with both metals feeding off of the surging oil price and drawing safe haven money their way.
Gold shot up right into its next resistance band on the chart near the $1420 level before setting back some. One can see the bids flowing into the screen and as they abate somewhat, the bullion banks are able to shove price lower with their offers. When the funds engage in another round of buying, the offers get overwhelmed and back up it goes. It is a similar situation in silver.
From a technical perspective, gold has now established $1420 as the last level that needs to be taken out before a run to the lifetime high commences. I am expecting the bullion banks to fight like hell at this level to prevent that but if crude continues its charge higher, and certainly if the unrest in Libya and elsewhere spreads to Saudi Arabia, no amount of BB selling is going to hold $1420 much less prevent a run to the old high.
Downside support can be expected near the $1400 level with strong support below that back near $1385.
The open interest data from yesterday’s gold and silver trading session is a tale of competing cities. Gold open interest surged over 14,000 with heavy speculative buying competing against heavy bullion bank selling (what else is new). Silver however saw a sharp drop in open interest which plunged a bit over 5,000 with the rollover beginning in earnest as traders move out of the March into the May contract. It is going to be interesting to see how the delivery process unfolds in the March c ontract as we enter that period next week. The backwardation structure still exists but it seems to be loosening up a bit based on where the first three futures months are trading as I write this.
On gold, a surge in open interest of this nature, is indicative of very keen interest on the part of Managed Money again. They look to have gold back in their crosshairs once again and if they keep returning at this kind of rate, it is not going to take them long to push the price up to the recent all time high above $1430.
The HUI is up but fading a bit from its best levels of the session here at . Technical indicators show a trending move is underway so dips should be expected to uncover buying support. Moving averages are all positive as well, further reinforcing the bullish picture. The one fly in the ointment is that big ugly downside bar on the chart from yesterday. It needs to be cleared to give the index a shot at running up towards the next resistance level on the chart which c omes in near 580.

Well - what do you know - after acting like fools and throwing away all their corn yesterday for no reason other than their damn black boxes told them to, the hedgies are in there today buying it all back again. As I commented yesterday, the unrest in the middle East is serious but it is not going to stop the rest of the world from having to deal with a shortage of corn stocks that had shows no signs of ameliorating. If they could not shut off demand at $7.00 for corn, they sure as hell are not going to shut it off any further by discounting the price another $0.40 /bushel. End users did what we expected them to do - they stepped up and bought all the corn that the hedge funds were throwing away.
Soybeans too recovered in price and the strength in those two markets help to pull wheat up, which is also in low supply but has been dropping because some of the big wheat buying countries are in the middle East and traders are uncertain how the unrest over there might affect the government bids for wheat on the global market.
Cotton has continued its recent sell off from record levels but looks like it might be finding a temporary bottom in here. That market is enough to make all of one's hair turn grey very quickly if you happen to get on the wrong side of it, either moving up or moving down. It is merciless and extremely volatile right now but even after its three day move lower, it is still incredibly expensive meaning all of us will be seeing higher prices for cotton goods, towels and clothing, for some time. That could not come at a better time seeing that we will soon be leaving our firstborn child at the gasoline pump.
Speaking of gasoline - it was up as much as 13 cents a gallon at the wholesale level today at one point and is currently trading over 12 cents higher. Think of how this is going to affect not only all of us consumers at the pump but all the businesses that move freight or packages or anything. The cost to haul our fruit, vegetables, and meat to the grocery store is going to rise not to mention here we go with the airlines once agian as aviation fuel costs rise further. What are they going to do next that they haven't already done - charge us for wearing clothes on the plane?


Safe Haven Dollar - What Safe Haven?
Dear friends:
I mentioned yesterday in my comments that the Dollar was very weak even in the midst of what was most certainly a day in which risk trades were being pulled off and a rush to safety was underway.
Normally during such events, the Dollar along with the Japanese Yen, tend to be the beneficiaries of such activity. All that the Dollar could do was to end up a few points after spiking initially almost 100 points higher. That sort of activity was very telling and indicates that the safe haven bid for the Dollar was practically non-existent.
Today, with crude oil soaring, the broad equity markets, particulary the Nasdaq, getting slammed, and increasing unrest in the middle East as fear grows about the stability of Saudi Arabia, the Dollar is actually getting sold off. That is most remarkable.
I am thinking that the market is looking at the fragile state of the US economy and voting that rising oil prices are going to hit the US harder than most others. Keep in mind, that this is an "economic recovery" built almost completely around the Fed's massive liquidity injections through its QE program. That liquidty is being eaten up by rising crude oil prices as if by a munching PacMan.
It is as if the Fed is pouring water into a container full of holes punched in it by a awl with the words "crude oil" engraved on the handle.
As I am writing this, I am also noticing that the long bond is fading quite dramatically from its best level of the session. That too will bear watching.

Subscribe to:
Posts (Atom)