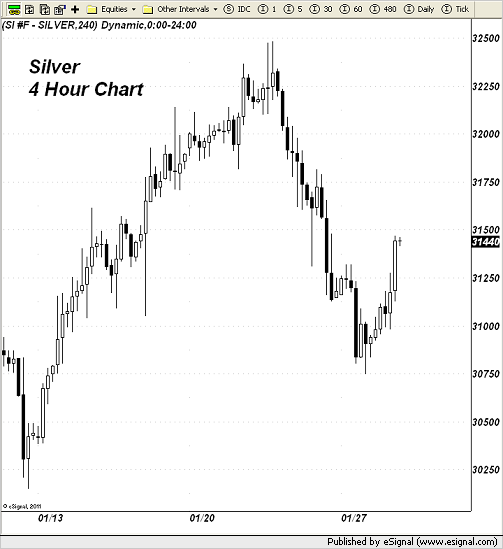
From a technical chart perspective, silver managed to return above broken support at the $31 level. Where it goes from here is anyone's guess. If the "Buy commodities" theme continues, silver will rise. If money flows reverse or slow into the sector, then sillver will move lower again. It really is that simple.
Volume of trades below the $31 level dried up and seemed to pick up a bit today when silver pushed above $31.25. From what I can see on this chart, if silver prices drop back below $31.10, it will probably move lower and retest yesterday's low. If it can push past $31.80 on the topside, it should revisit $32.25.
We will just have to watch.
Take a look at the following chart of the CCI and again compare it to the Silver chart. See how closely the two track each other. It is quite remarkable.

Following is a chart of the US Dollar, which is stuck in a broad coiling pattern. It is encountering selling up towards 81 and buying down towards 79. I believe that were it not for the persistent weakness in both the British Pound and the Japanese Yen, that this particular Dollar index would have already broken down to the bottom.
Those two particular currencies TOGETHER make up 1/4 or 25% of the value of the index and have both been dropping quite hard.

Here is another chart detailing the GOLD/CRUDE OIL ratio (note that I am using WTI and not Brent). As you can from the chart, gold has basically been losing ground against crude oil since late last year. This ratio is currently trading near 17 to 1. For now, inflation fears from a steadily rising crude oil price ( it is up above $97 today and looks to make a run towards $100) are not concerning the gold market.

The HUI is attempting to hang onto a key chart support level at the 400 level. As I mentioned on both the KWN Weekly Metals Wrap and in a separate post here on the site, this key mining sector index has not had a MONTHLY CLOSE BELOW the 400 level in three years. It has spiked below this level but on all occasion since then, it has managed to climb back over the 400 mark. Tomorrow is the end of the month so I am going to be paying very close attention to what it does. Bulls will not want to see this index close below 390.

Lastly, the S&P 500, the bubble that keeps on expanding, is now trading above the 1500 mark and looks as if it is now heading to 1530. It is takes that out, it is going to retest the ALL TIME HIGH. How do ya like those Federal Reserve officials and their skill at blowing one bubble after another. Are they good or what!
